e-Portfolio #2
Andrew S. Edgar
Tropical Forecasting 241
e-Portfolio Assignment #2
Introduction
The purpose of this e-Portfolio entry is to analyze how the 1982-1983 El Niño event influenced the subtropical jet over the Pacific Ocean and United States and, consequently, how seasonal temperature and precipitation in the U.S. Gulf Coast States were impacted. El Niño occurs when the surface waters of the eastern equatorial Pacific become warmer than the climatological average by several degrees Celsius. This occurs when westward-blowing equatorial trade winds weaken and warm ocean water, which originally had been pushed by the trade winds and piled-up against Indonesia in the western equatorial Pacific, begins to “slosh” back toward the east. Animation #1, courtesy of the National Oceanographic and Atmospheric Administration (NOAA), and Animation #2, courtesy of the Penn State Department of Meteorology and the John A. Dutton e-Education Institute, illustrate the effects that El Niño has on temperature distribution in the equatorial Pacific Ocean. This change in temperature distribution also has a profound effect on the atmosphere by altering the atmospheric circulation over the equatorial Pacific known as the Walker Circulation. As illustrated in Figure 1, a shift of the Walker Circulation caused by El Niño has an impact on where convection and thunderstorm formation occurs in the tropics, essentially moving the zone of highest convection from the western equatorial Pacific to the central and eastern equatorial Pacific.
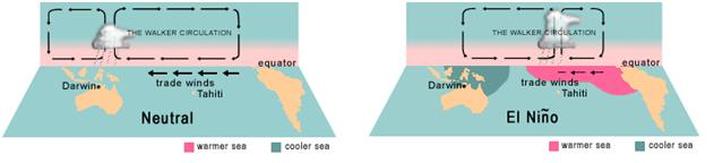
Figure 1: The Walker Circulation during neutral years (left) and during an El Niño event (right). Note that the ascending branch of the
Walker Circulation, where convection and thunderstorm activity is maximized, shifts from the western equatorial Pacific to the
central and eastern equatorial Pacific. These images are courtesy of the Australian Government Bureau of Meteorology.
El Niño and the Subtropical Jet
Increases in sea surface temperatures and convection in the eastern equatorial Pacific caused by the 1982-1983 El Niño event directly impacted the pattern of the subtropical jet over the Pacific Ocean and U.S. Gulf States. In the Pacific, the subtropical jet was extended to the east, while over the Gulf States the jet was diverted further to the south toward Florida and the northern Gulf of Mexico. Figure 2 illustrates this deviation from the climatological mean.
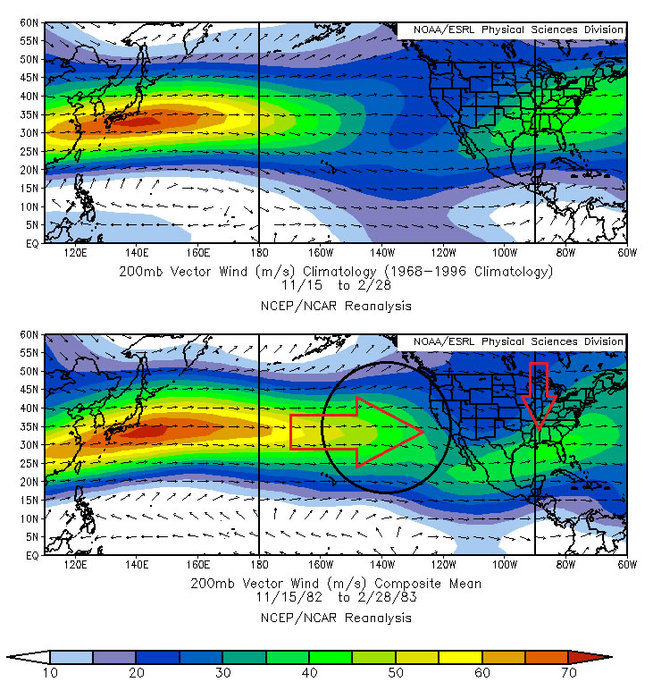
Figure 2: The 200mb climatological mean vector winds (m/s) of the subtropical jet for the period Nov 15th – Feb 28th (top)
and the composite mean vector winds (m/s) for the period Nov 15th, 1982 – Feb 28, 1983 (bottom), which was during
the 1982-1983 El Niño event. Note that in the Pacific the mean winds during the El Niño event were extended
anomalously to the east while over the U.S. winds were diverted to the south over the northern Gulf of Mexico and
Florida. These figures are courtesy of NOAA’s Earth System Research Laboratory – Physical Sciences Division.
How did these changes in the subtropical jet occur? Anomalously warm surface water in the eastern and central Pacific transferred heat into the upper atmosphere through convection. As seen in Figure 3, this heat reached all the way into the upper atmosphere, specifically to 400mb, where the subtropical jet has its roots.
Figure 3: 400mb air temperature composite anomalies (oC) for the period 11/15/1982 – 02/28/1983. Note the anomalously high
temperatures in the circled region. This temperature anomaly was caused by increased sea surface temperatures
during the El Niño period and heat transfer into the upper atmosphere through convection. This image is courtesy
of NOAA’s Earth System Research Laboratory – Physical Sciences Division.
As this column of air was heated through the upper atmosphere, it expanded and increased its thickness, which in turn caused the heights of pressure levels to rise. This generated anomalously high heights in the heated column which led to a large north-south height gradient over the mid-latitude eastern Pacific that extended to the level of the subtropical jet at 200mb. Another impressive height gradient also formed at 200mb over the northern Gulf of Mexico and Gulf States. These height gradients are illustrated in Figure 4. In response to the large height gradient over the eastern Pacific, the subtropical jet surged further eastward than the climatological mean. Over the Gulf States, the position and strength of the height gradient caused the subtropical jet to intensify and divert to the south over the northern Gulf of Mexico and Florida.
Figure 4: 200mb geopotential height composite anomalies (in meters) from the period 11/15/1982 – 02/28/1983. Note the large
height gradient circled over the eastern Pacific (large circle) that is responsible for extending the subtropical jet to the
east. Also note the smaller but equally important height gradient over the U.S. Gulf States (small circle) that is
responsible for intensifying the subtropical jet and pushing it south over the northern Gulf of Mexico and Florida.
This image is courtesy of NOAA’s Earth System Research Laboratory – Physical Sciences Division.
Seasonal Impacts of the 1982-1983 El Niño
How did the El Niño-generated anomalous subtropical jet stream impact temperature and precipitation over the U.S. Gulf States during the winter season of 1982-1983? We must first begin by discussing the dynamics of jet streaks. Jet streaks are zones of increased wind velocity located within a larger jet, in our case the subtropical jet. A jet streak can be divided into four quadrants: the left and right entrances and the left and right exits. The left exit and right entrance regions are zones of upper-level divergence and, consequently, areas where rising air motion is promoted. It is where there is rising motion (negative omega) that cloud formation, convection, and precipitation can occur. Figure 5 illustrates the connection between a jet streak documented on December 12, 1983 at 6Z and the precipitation that occurred as a result.
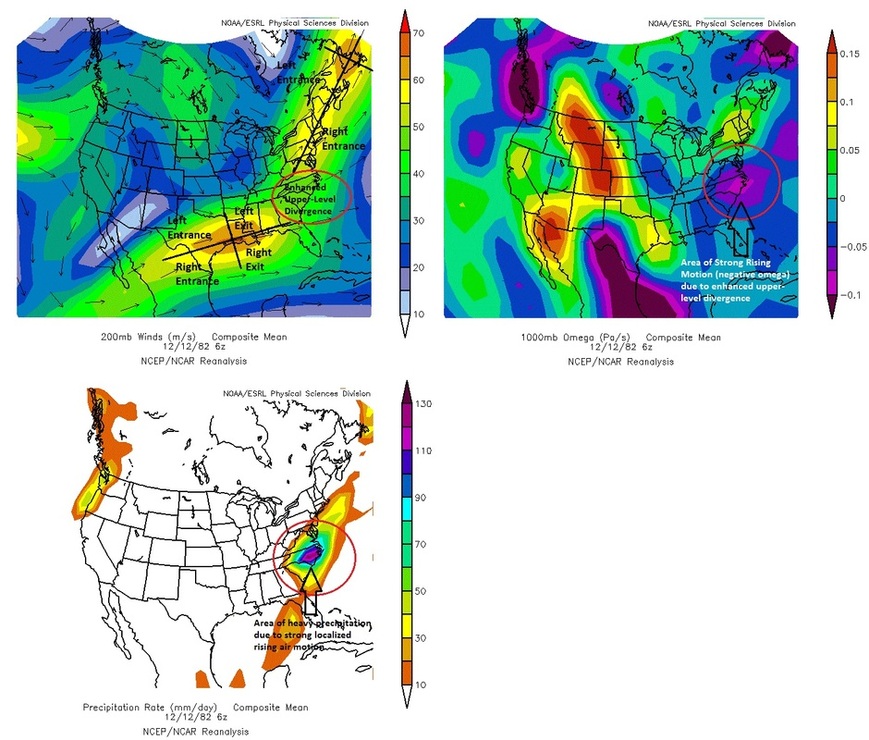
Figure 5: A series of images generated for December 12, 1983 highlighting the connection between the divergence found in the left exit and right entrance of jet streaks
and the potential for precipitation. The upper-left figure shows two jet streaks with labeled quadrants. The red circle indicates where the left exit of the
southern jet streak and right entrance of the northern jet streak intersect. This is where upper-level divergence will be greatest. The upper-right figure
illustrates the resultant rising air motion (negative omega) generated from the enhanced upper-level divergence. The lower-left figure indicates where the
greatest amount of precipitation fell on 12/12/83. Note that the location of the precipitation maximum lies beneath the zone of enhanced upper-level
divergence and within the zone of strongest rising air motion.These images are courtesy of NOAA’s Earth System Research Laboratory – Physical Sciences
Division.
Now that I have developed a connection between the upper-level divergence found in the left exit/right entrance of a jet streak and the potential for precipitation, we can begin to understand how the El Niño-altered subtropical jet had an impact on weather in the Gulf States during the 1982-1983 winter season. Figure 6 illustrates the deviation of temperature and precipitation in the continental U.S. from the average for the period 11/15/1982 – 02/28/1983.
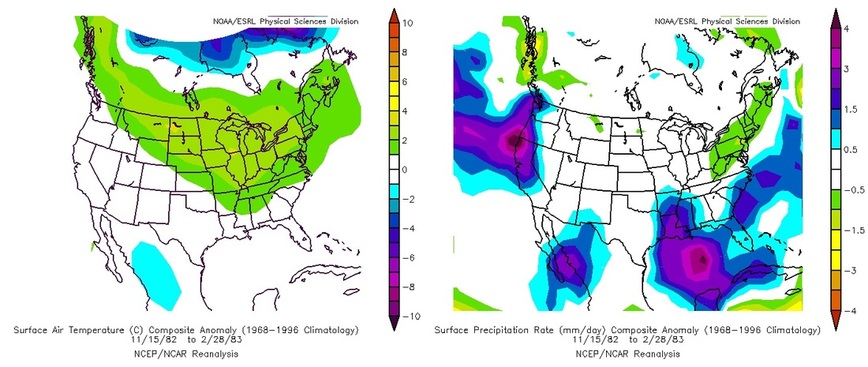
Figure 6: Temperature anomalies (left) and precipitation anomalies (right) recorded during the period 11/15/1982 – 02/28/1983, which was during the 1982-1983 El Niño
event. Note that the Gulf States experienced average temperatures and above-average precipitation. These images are courtesy of NOAA’s Earth System
Research Laboratory – Physical Sciences Division.
We can see that the U.S. Gulf States experienced average temperatures and above-average precipitation. The lack of any substantial temperature anomaly is surprising since, statistically speaking, during an El Niño event the Gulf States often have a tendency to be both wetter and cooler than average. These seasonal effects are not necessarily direct results of El Niño, but rather are teleconnections, which, in this case, are the statistical correlations between El Niño and the cooler and wetter weather often associated with El Niño during winter in the Gulf States.
Concerning the above-average precipitation, this was likely caused by upper-level divergence generated in the left exit and right entrance regions of the anomalous subtropical jet over the northern Gulf of Mexico. However, as we can see from Figure 6, the greatest amount of anomalous precipitation fell over the Gulf itself rather than the Gulf States. In fact, large portions of Texas, Alabama, and Florida, saw minimal above-average precipitation (less than 1mm/day above average) or no anomalous precipitation at all. Clearly, the link between El Niño and above-average precipitation in the Gulf States is not set in stone.
The unimpressive anomalous precipitation over a number the Gulf States aids in explaining why the temperatures are merely average as opposed to below-average. Logically, where there is precipitation, there are clouds. Normally, the enhanced rising motion generated by the left exit of the anomalous subtropical jet streak would have increased the likelihood of cloud formation and precipitation in the Gulf States. This combination of above-average cloud cover and rainfall would act to keep seasonal temperatures below average. However, if there was less than substantial cloud cover and precipitation in many of the Gulf States during the winter season of 1982-1983, it would be unlikely that, on average, temperatures would be abnormally cooler during this time period.
Conclusion
The anomalous pattern of the subtropical jet over the Pacific Ocean and U.S. Gulf States during the winter season of 1982-1983 was a direct result of the El Niño event taking place at the time. The anomalously warm temperatures found in the eastern equatorial Pacific caused the column of air above to expand, raising heights and generating abnormally large height gradients over the mid-latitude Pacific and Gulf of Mexico. Over the Gulf, this enhanced height gradient served to draw the subtropical jet south over the northern Gulf, placing the Gulf States in an area of enhanced rising motion and enhanced precipitation.
However, as we observed with the temperature and precipitation anomalies in the Gulf States, the link between the altered subtropical jet and a cooler and wetter El Niño winter is not set in stone. In this case, precipitation, while above average, was less than impressive, and temperatures were merely average, not below average which is statistically likely during an El Niño event.
This only serves to prove that El Niño itself does not have a direct effect on weather and cannot be used to confidently forecast any particular weather pattern. Even after El Niño diverted the subtropical jet over the Gulf of Mexico, the pieces didn’t completely fall into place over the Gulf States. As such, though statistical correlations can be drawn between El Niño and weather patterns, concrete forecasts for seasonal or even tropical weather based on El Niño should be taken with a grain of salt.
